Context & Engineering Objective
Small electric vehicles are useful only if their energy use, charging behavior, and environmental limits can be measured as one system. This semester project turned a Ninebot Model S and Mecha Kit into an instrumented testbed rather than treating telemetry, charging electronics, and mechanical packaging as disconnected assignments. The engineering objective was to connect on-vehicle energy measurement with a controllable SAE J1772 charging interface, then use that platform to study scheduled charging, cold-weather behavior, and practical hardware integration.
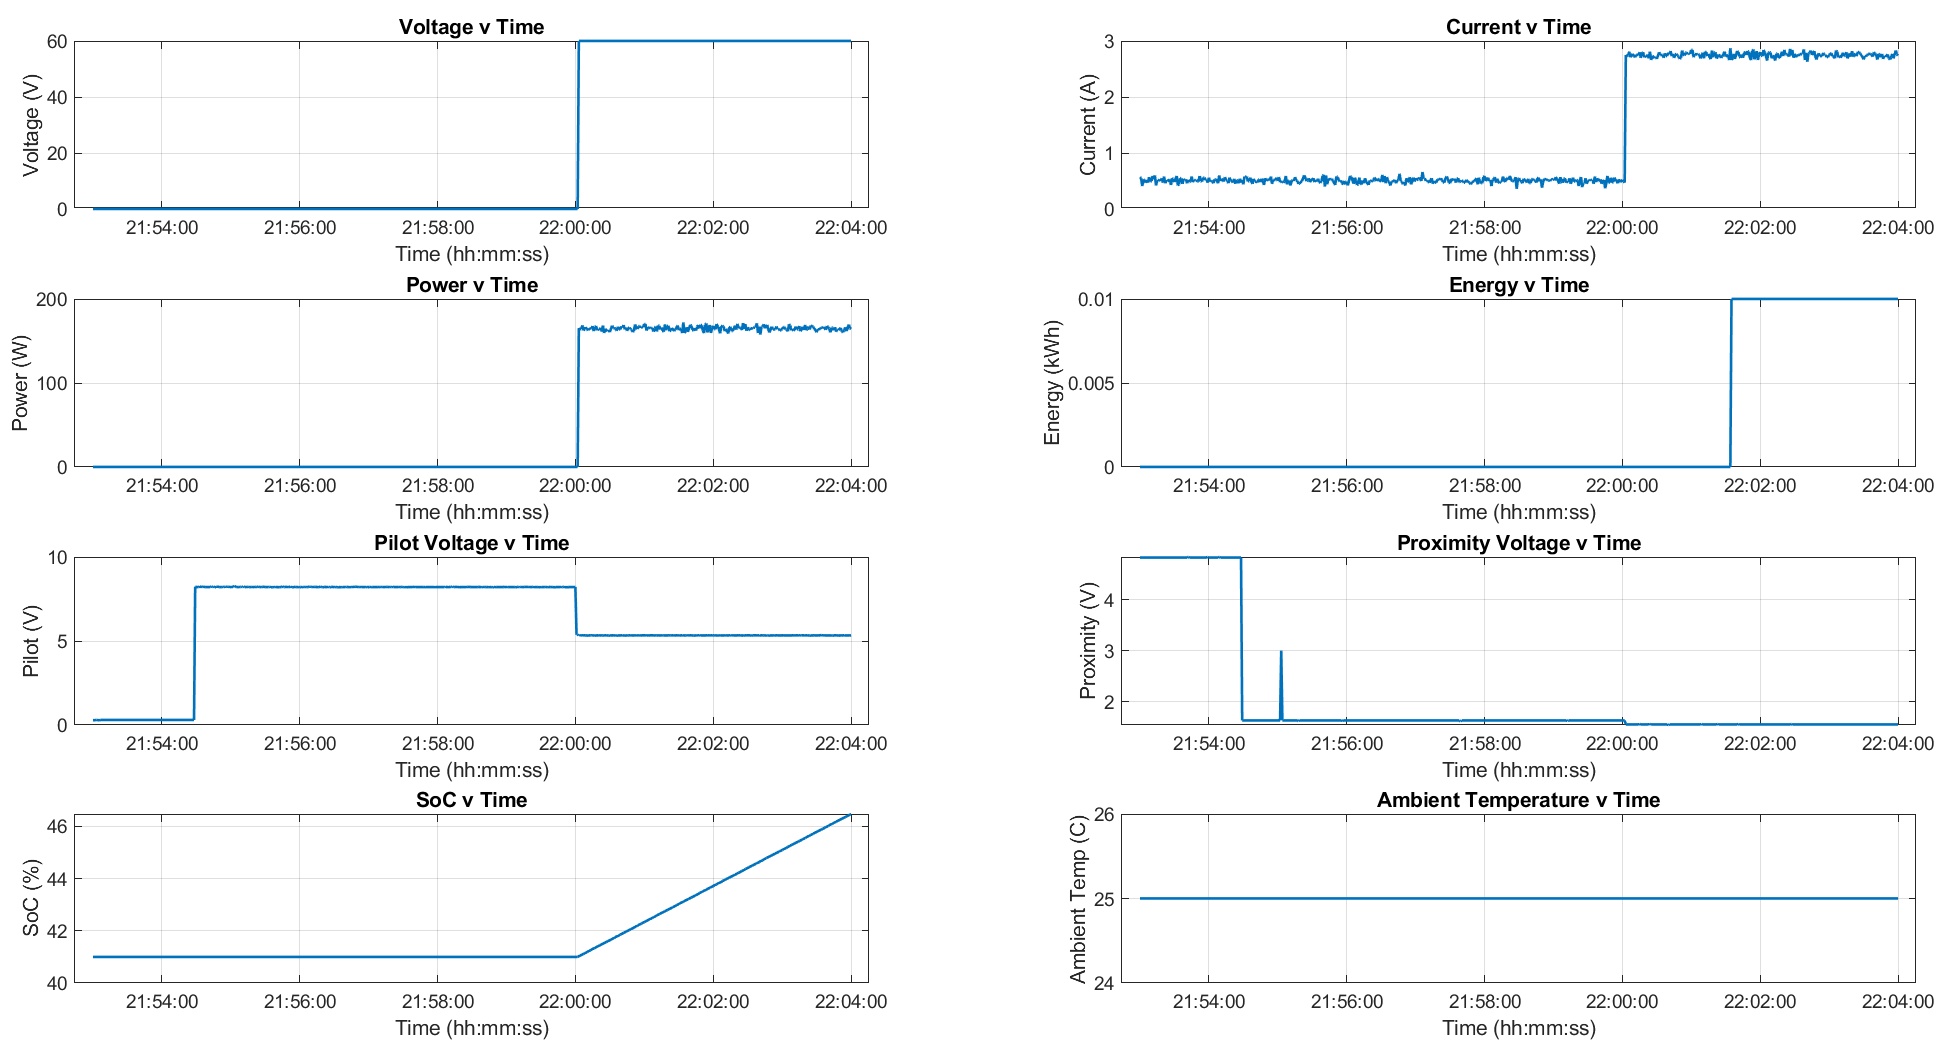
The strongest outcome was the hardware charging test: the system recognized pilot and proximity states, activated the charger from 0 to 60 V, observed current rise to approximately 2.7 A, and stabilized near 120 W while logging the transaction. That result demonstrates a functioning test platform, not a production charger or a claim of grid-scale benefit.
Role & Project Scope
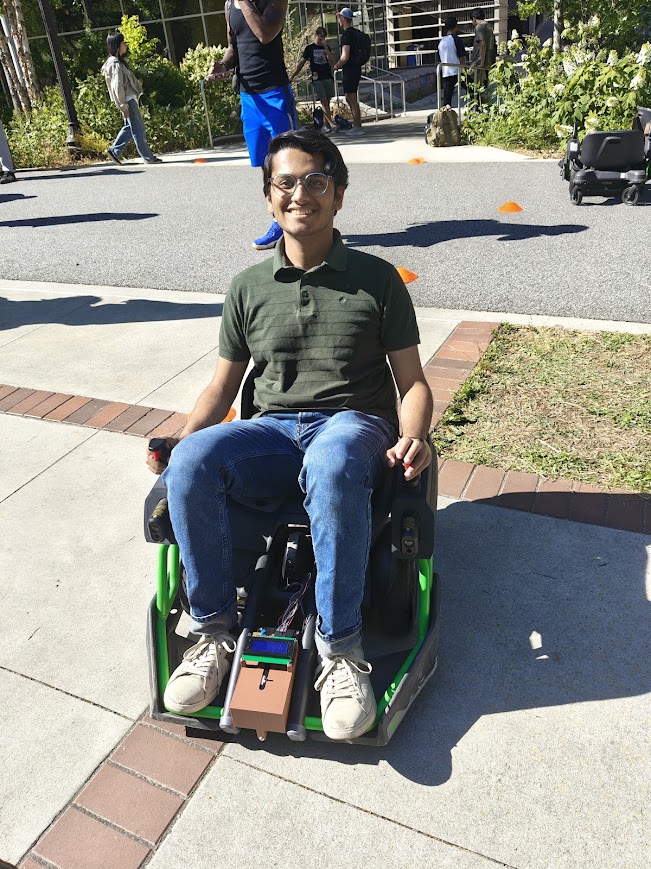
The work was completed as a team across four connected workstreams: timestamp-aware lap-energy measurement, Arduino-controlled J1772 charging, rule-based charging scenarios, and environmental and packaging extensions. I drove one of the two measured laps and contributed to the integrated experimental narrative. The evidence on this page deliberately separates physical measurements from modeled and proof-of-concept results so that programmed scenarios are not presented as field deployments.
Methodology
1. Timestamp-Aware Energy Telemetry
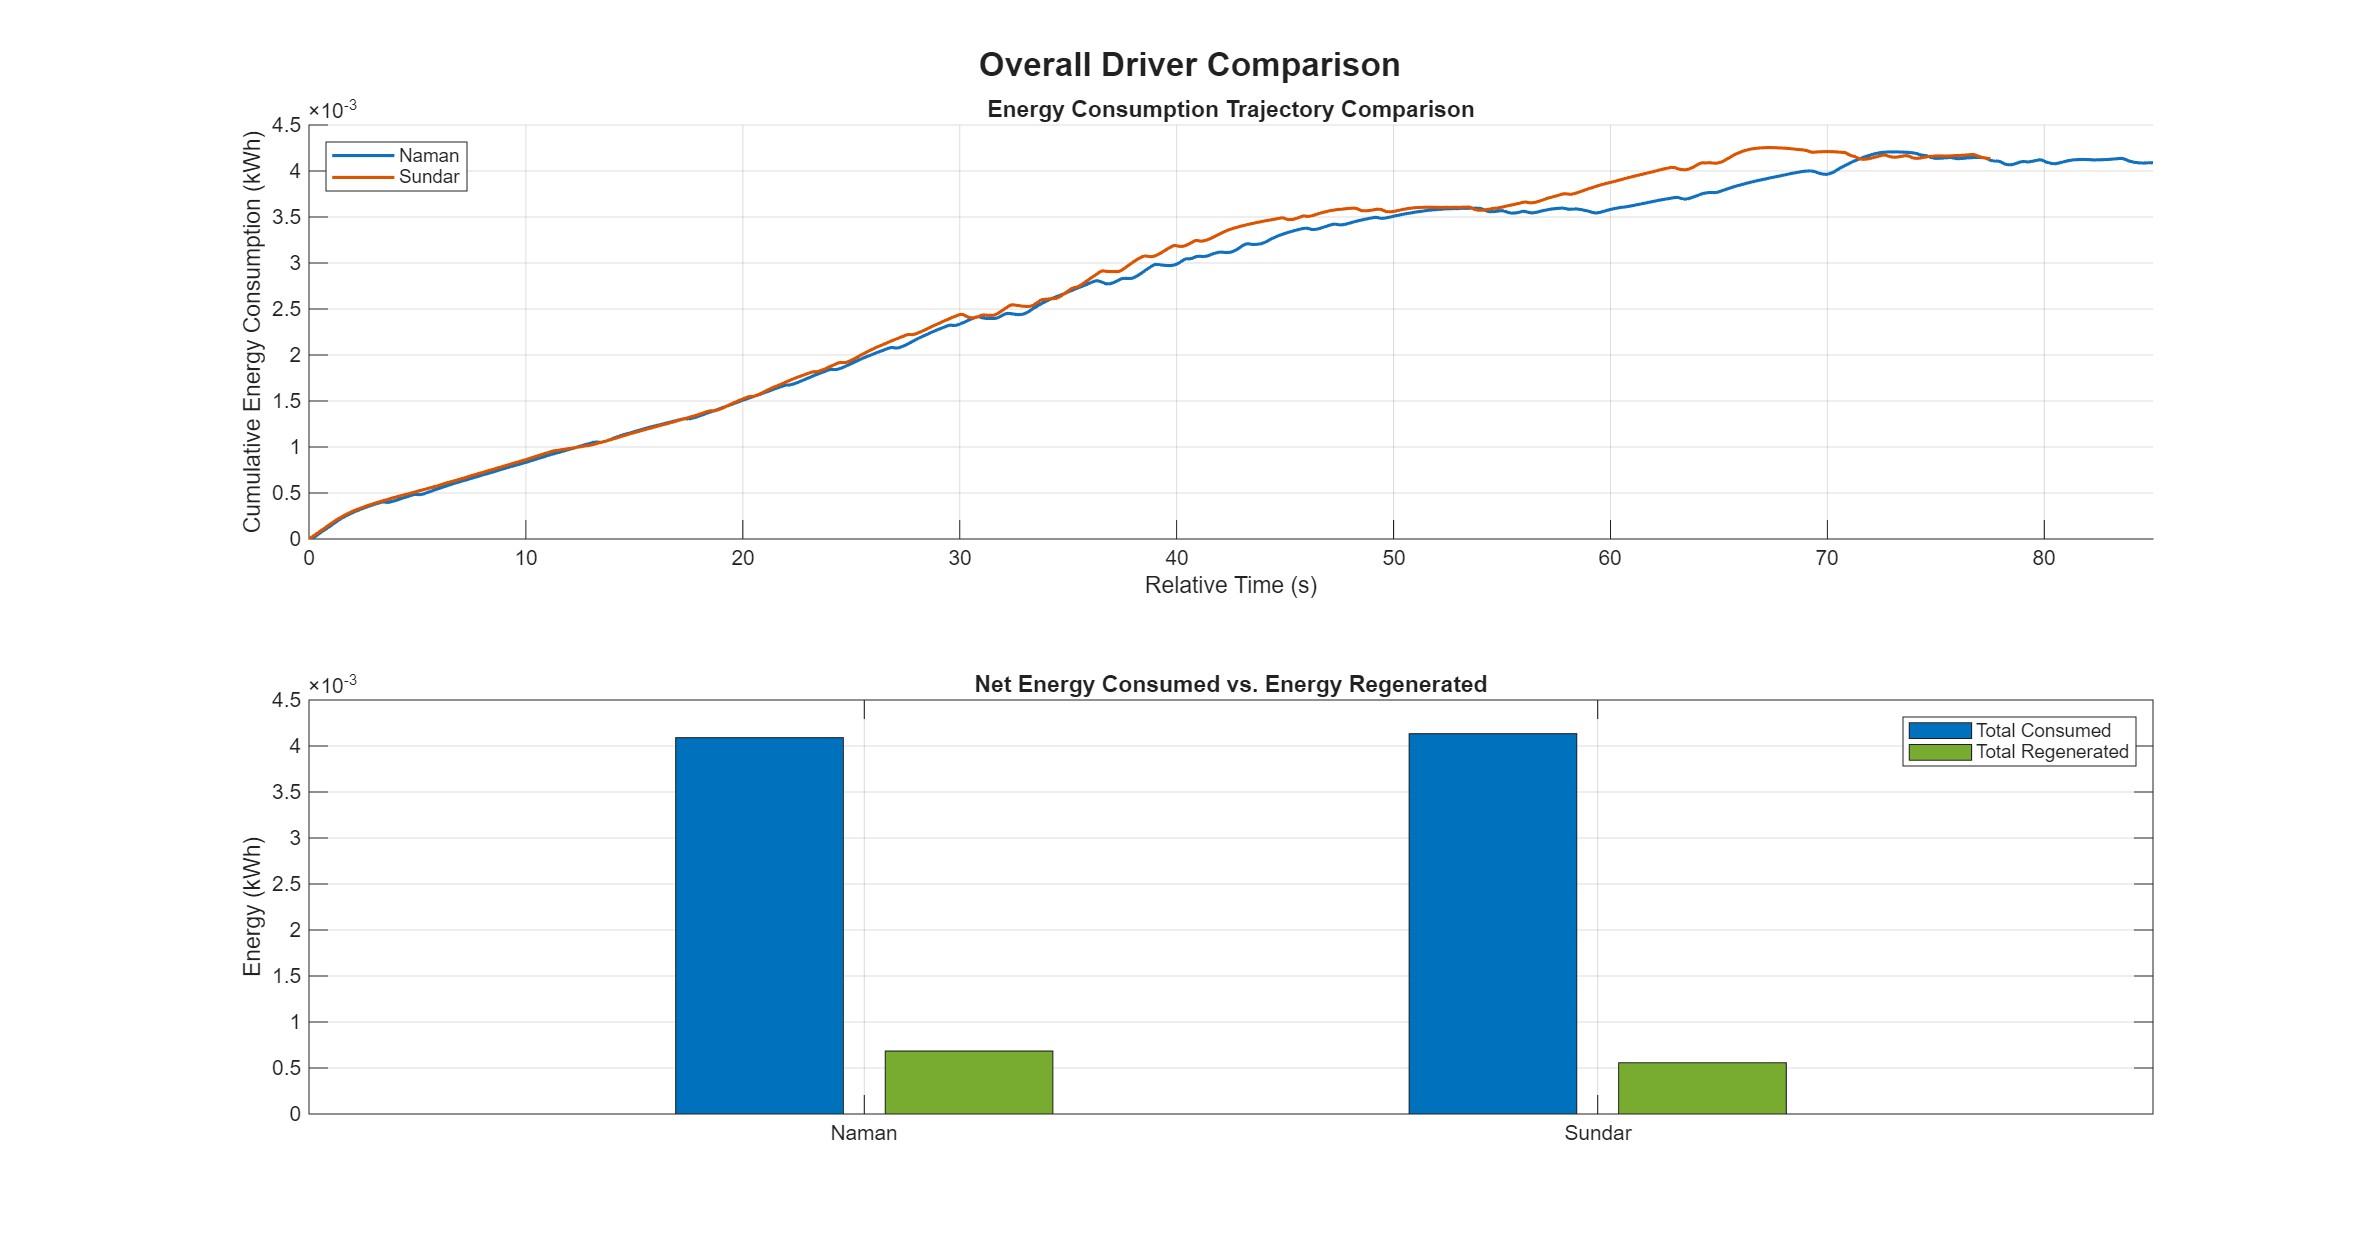
The Ninebot logger sampled voltage and current at roughly 10 Hz while two drivers completed equivalent laps. Because the logger timestamps were not uniformly spaced, assuming a fixed sample interval would have biased the energy estimate. MATLAB therefore integrated power with the actual timestamps using the trapezoidal rule and separated positive battery draw from negative regenerative-braking power.
Measured Reconstructed lap totals were 4.11 and 4.13 Wh. The onboard logger reported 4.47 and 3.60 Wh for the same laps, a useful cross-check that also exposed sensitivity to sampling, transient capture, sensor noise, and driving style. My lap recovered 2.82 Wh through regenerative braking, compared with 1.67 Wh for the other driver.
2. J1772 Charging Interface
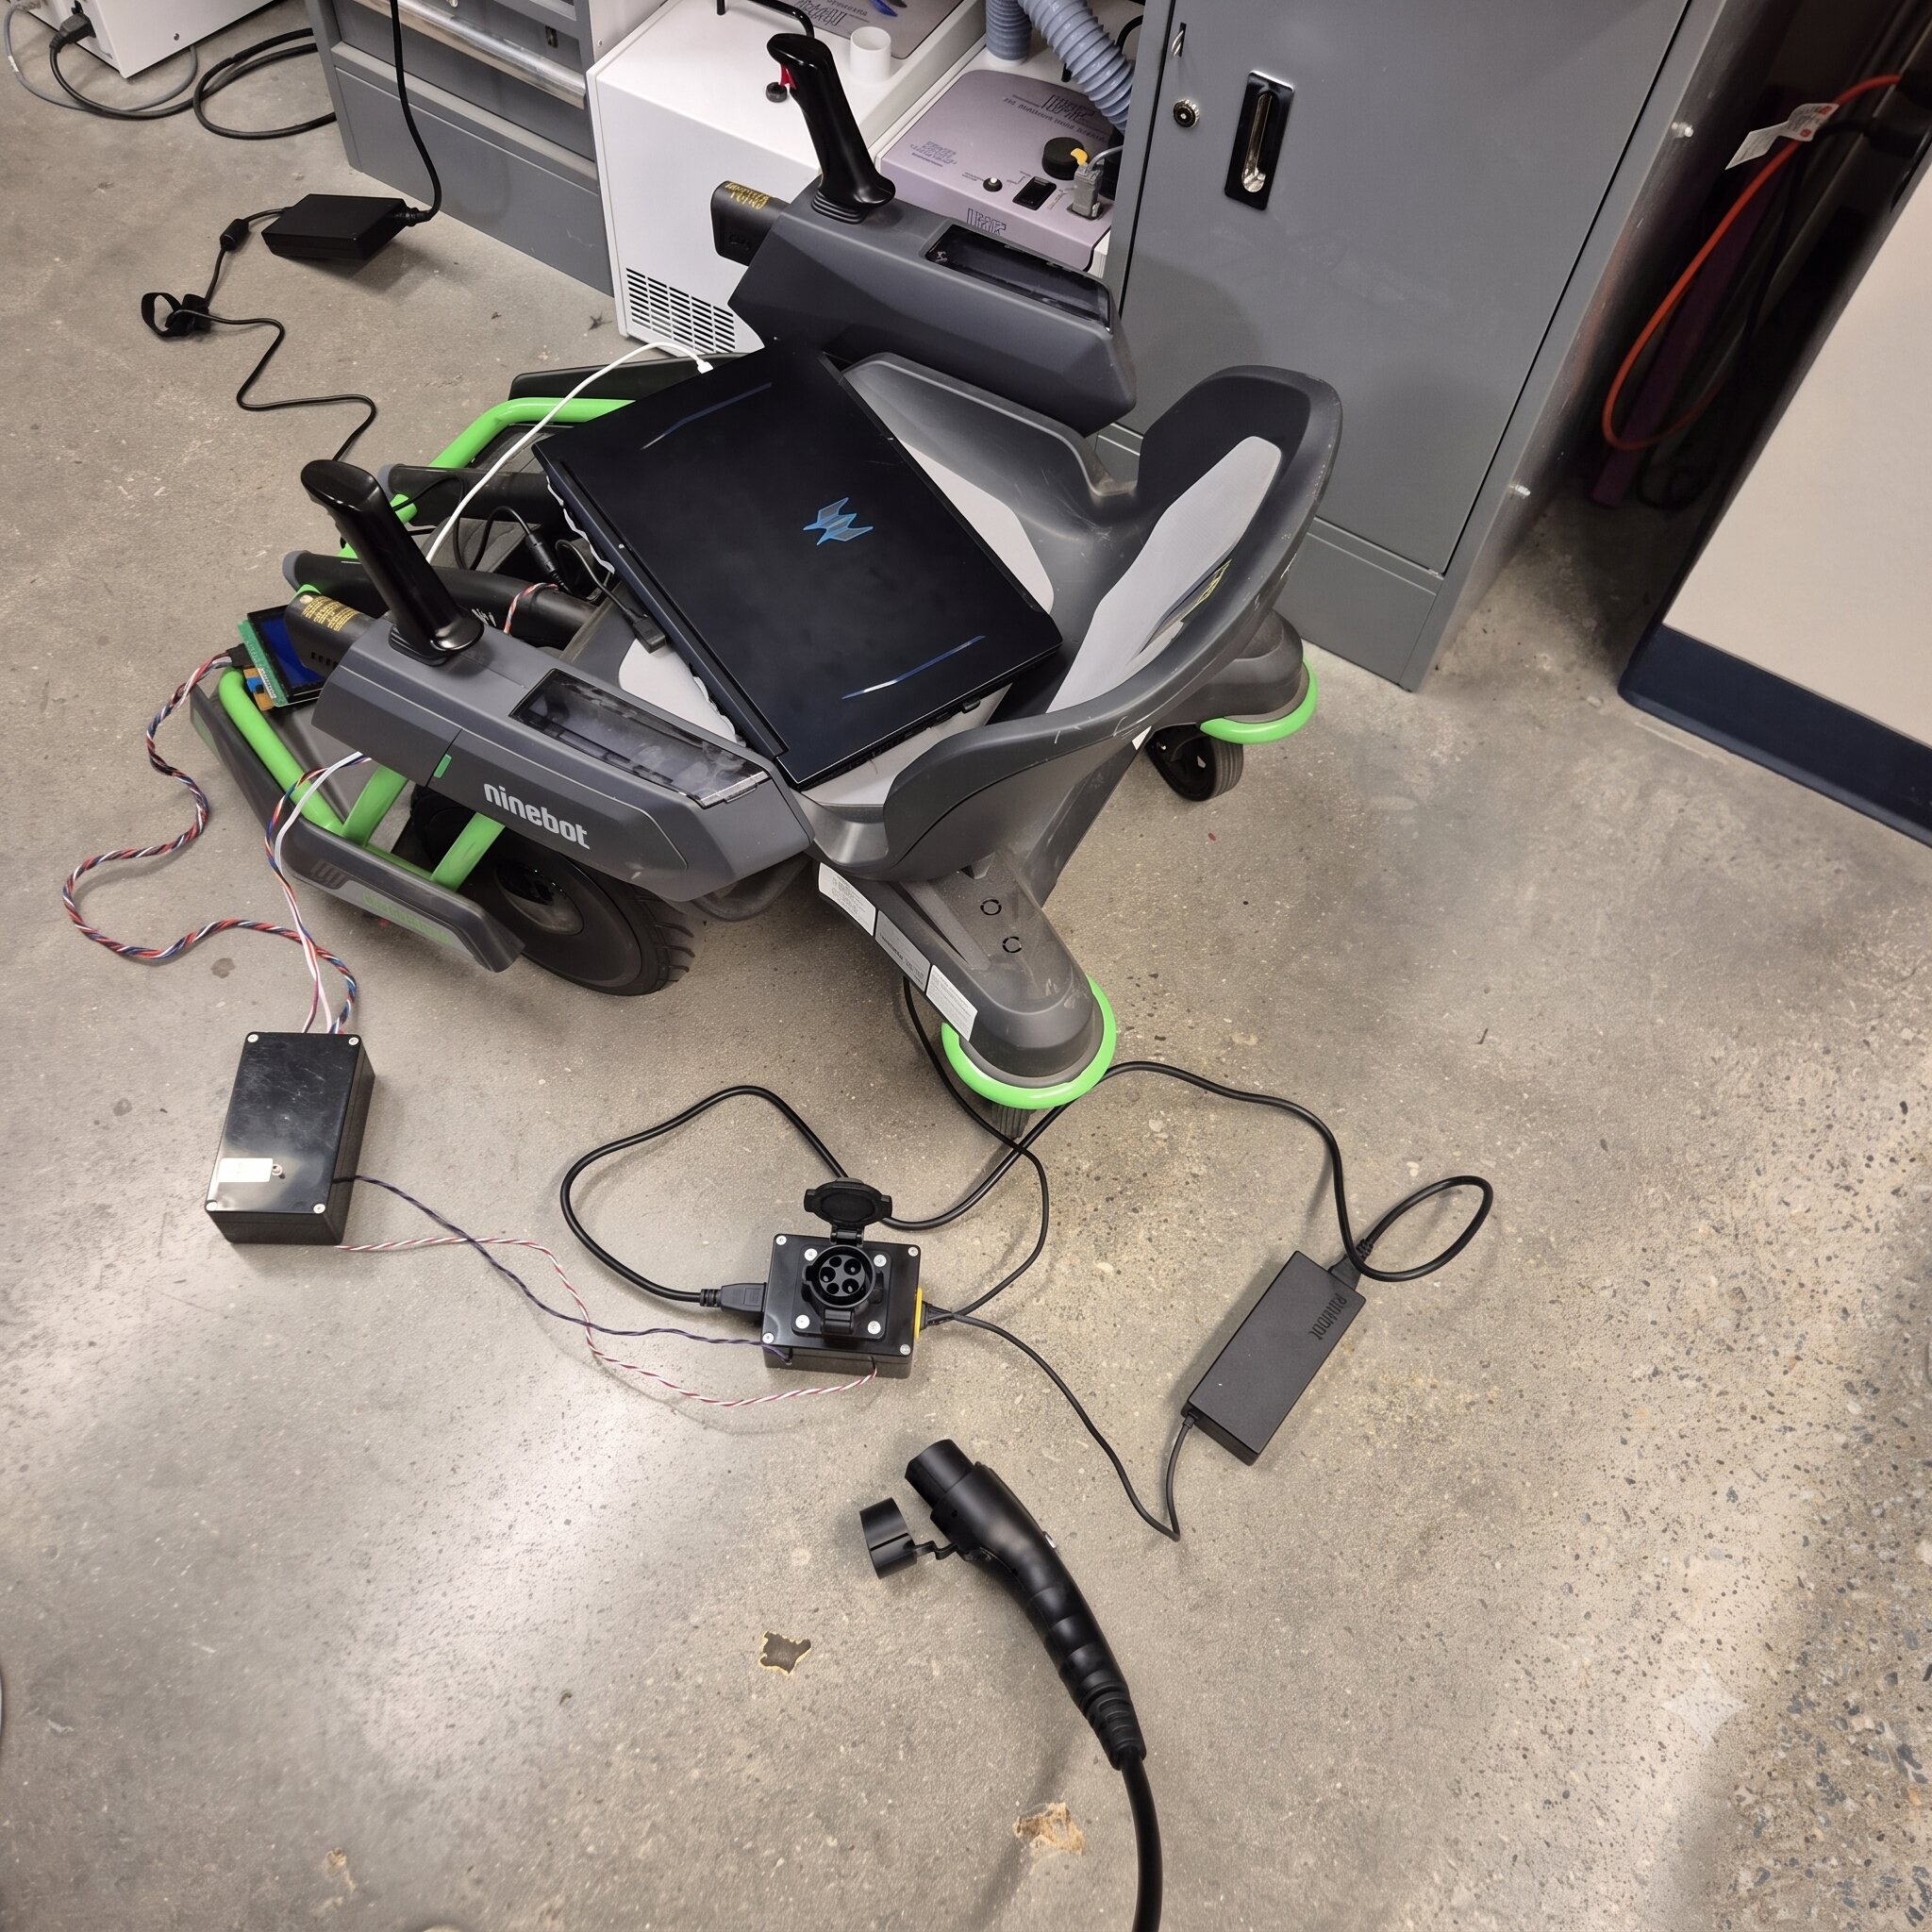
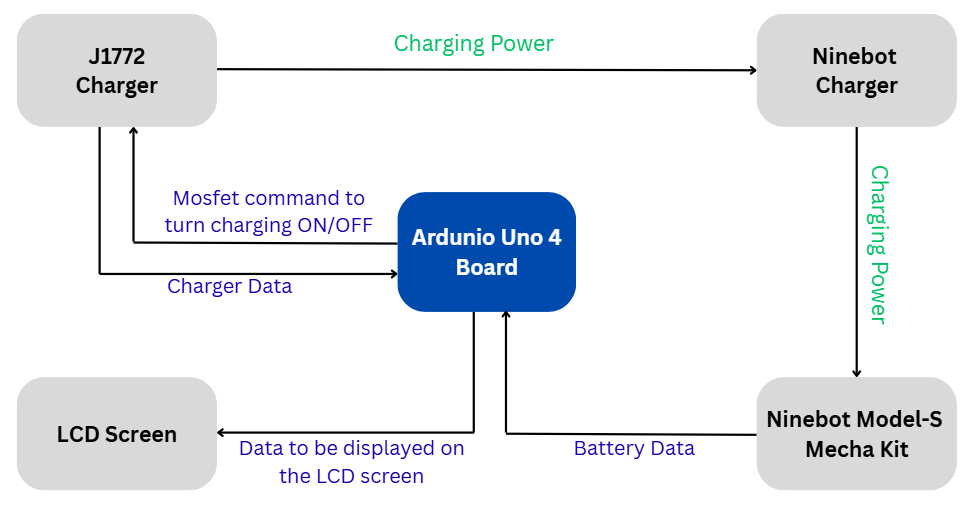
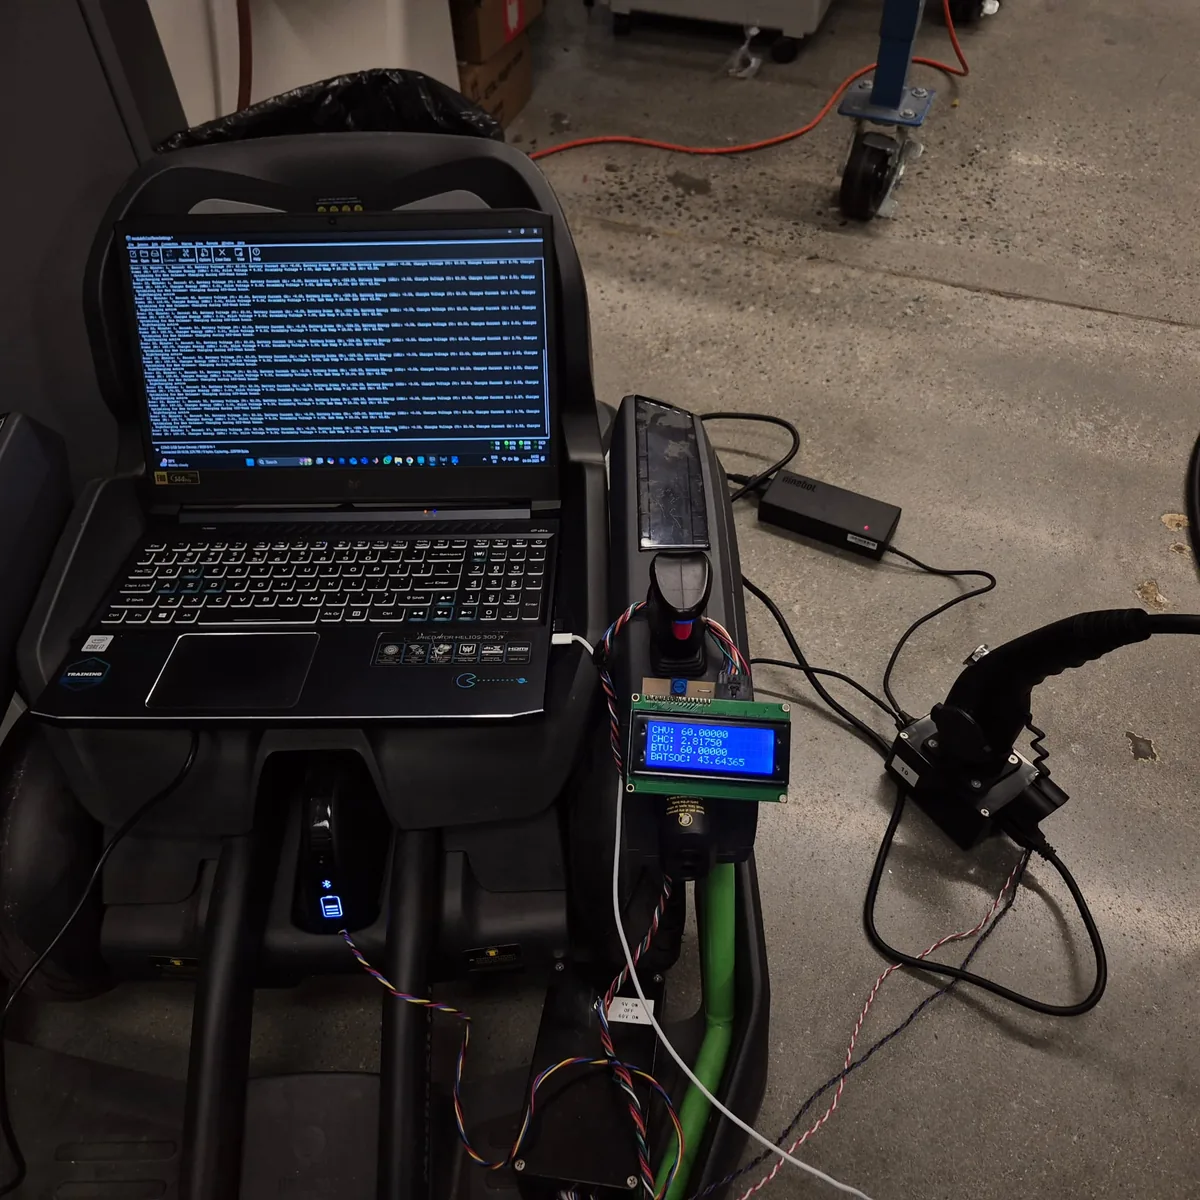
A J1772 adapter supplied the standard Ninebot charger while an Arduino Uno R4 interpreted charger states, controlled a MOSFET, updated an LCD, and logged battery-side measurements. The interface combined the SAE pilot and proximity signals with time-window, temperature, weather, and state-of-charge logic. At the programmed 22:00:01 start, output voltage moved from 0 to 60 V and current rose from approximately 0.4 to 2.7 A before the system settled near 120 W.
Measured Connection-state measurements were approximately 8.22 V on the pilot and 1.63 V on proximity. When charging began, the pilot measurement transitioned to about 5.33 V. These signals, rather than a timer alone, made the bench test a charging-communication experiment with sensing, actuation, operator feedback, and logging in one control path.
3. Programmed Charging Scenarios
The controller encoded off-peak and solar-daytime windows for Atlanta, Charleston, New Orleans, and New Jersey. Charging was permitted only when the local time was inside an allowed window, temperature exceeded 20°C, the weather input did not indicate a thunderstorm, and state of charge remained below 100%. These were hardcoded time and weather scenarios used to exercise decision logic—not live weather feeds, tariff integrations, or deployments in four cities.
4. Environmental and Packaging Extensions
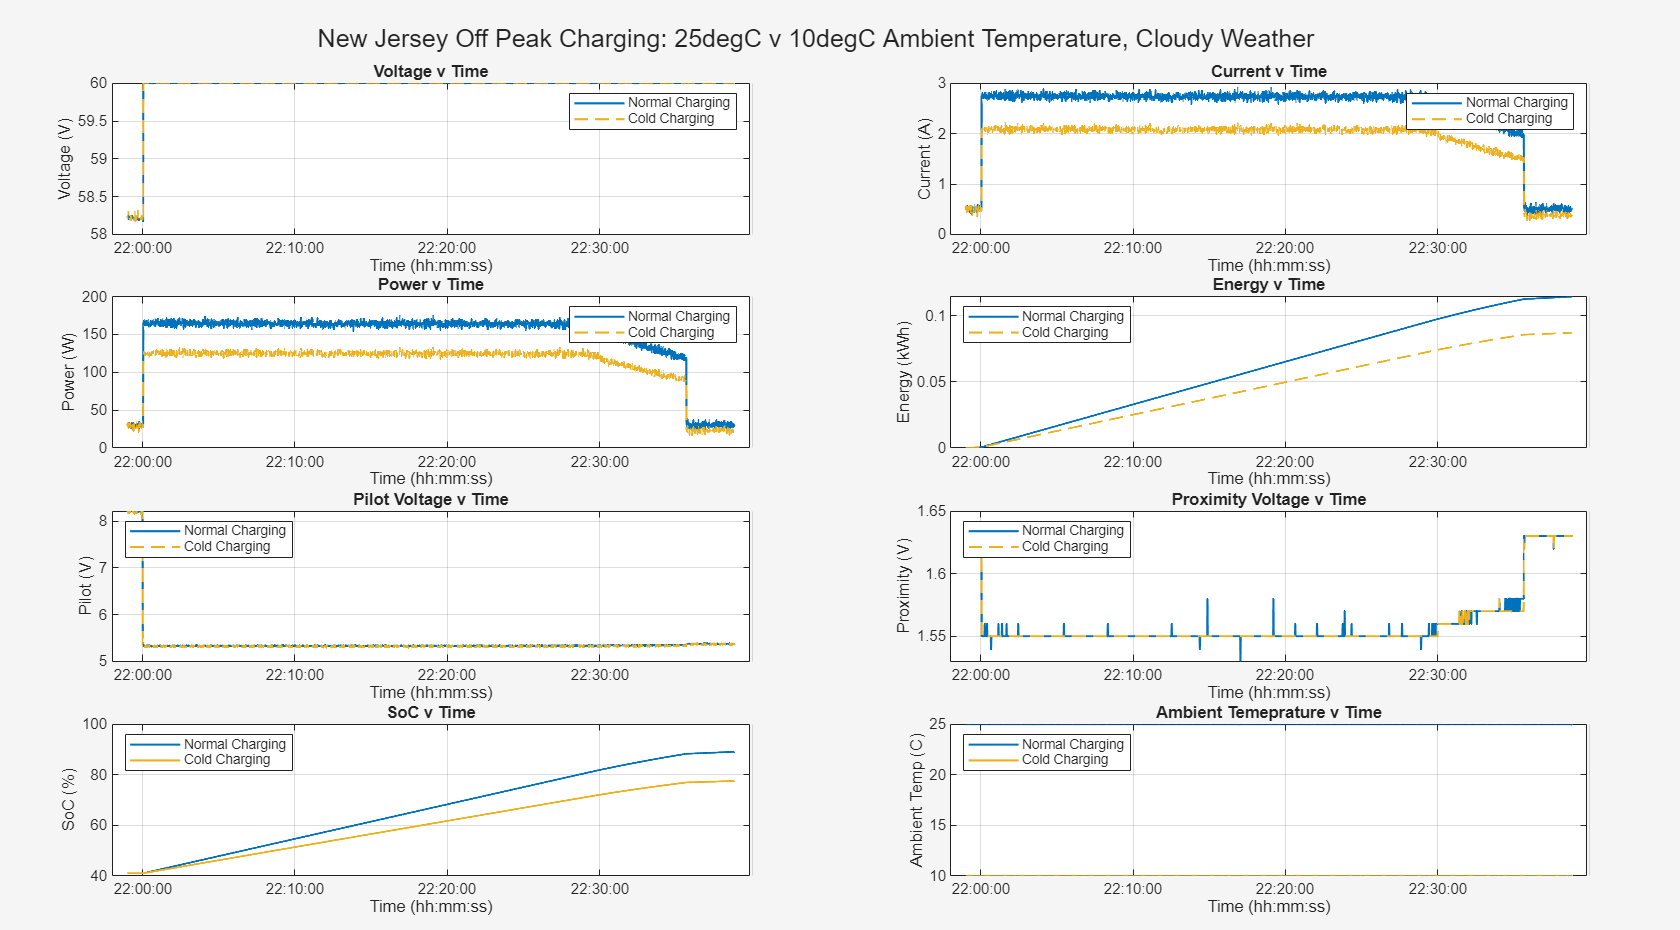
Simulated A measured 25°C charging trace became the baseline for a literature-informed MATLAB scenario at 10°C. Its exponential current-temperature relation was parameterized to move from 2.7 A at 25°C to 2.1 A at 10°C; it was not identified from measured temperature-sweep data. The scenario consequently predicted power changing from roughly 170 to 120 W, delivered energy from 0.11 to 0.08 kWh, and final state of charge from about 88% to 78%. Pilot and proximity signals were unchanged because the model altered battery acceptance rather than the interface state machine.
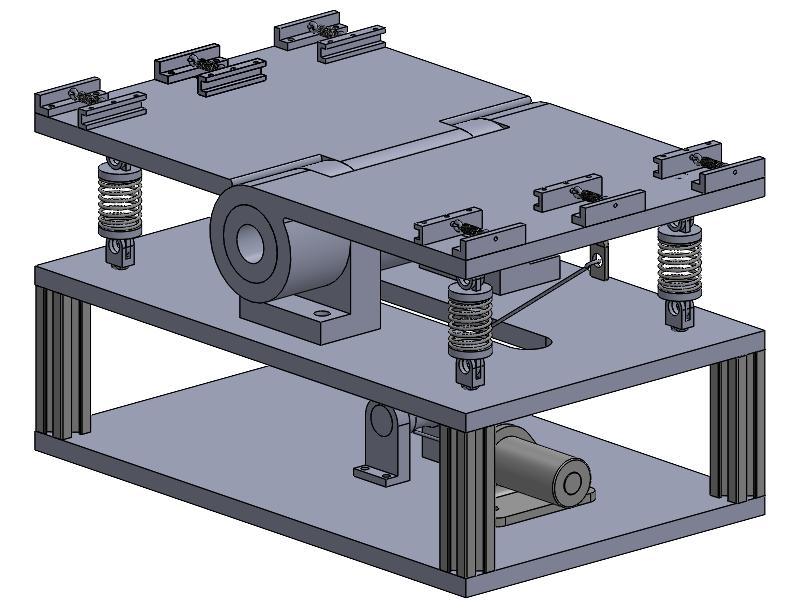
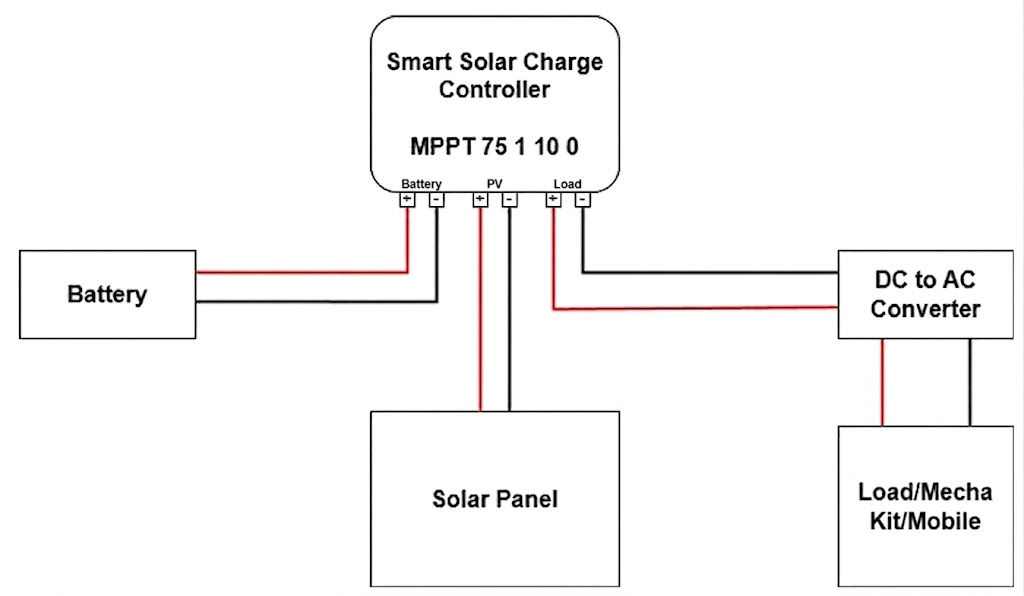
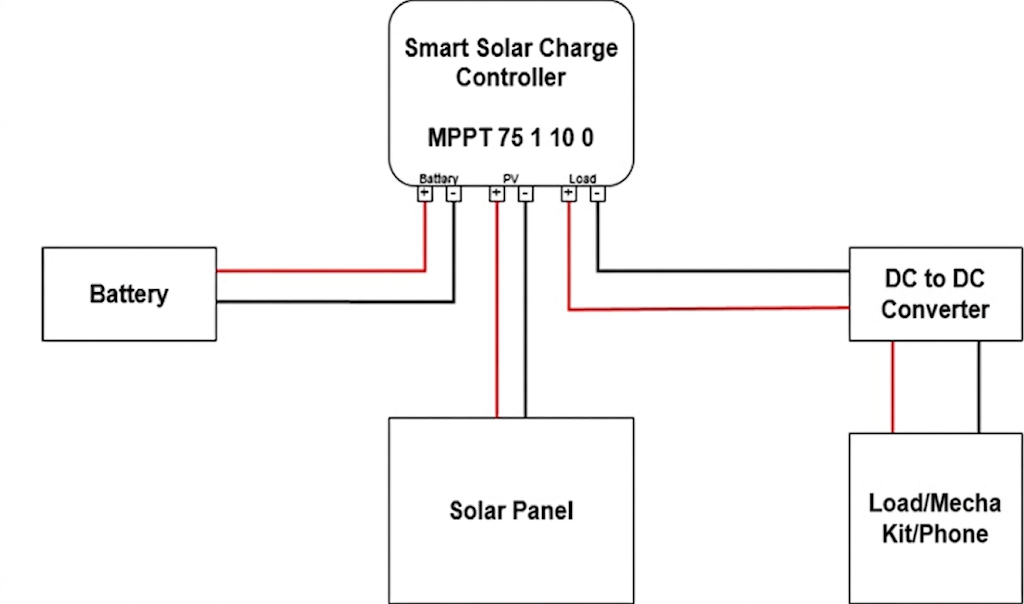
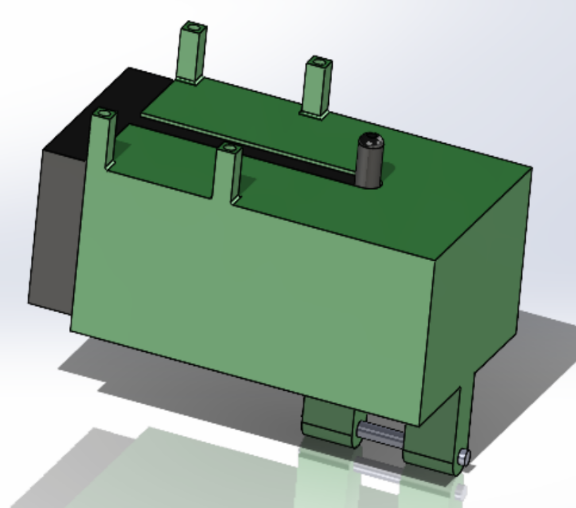
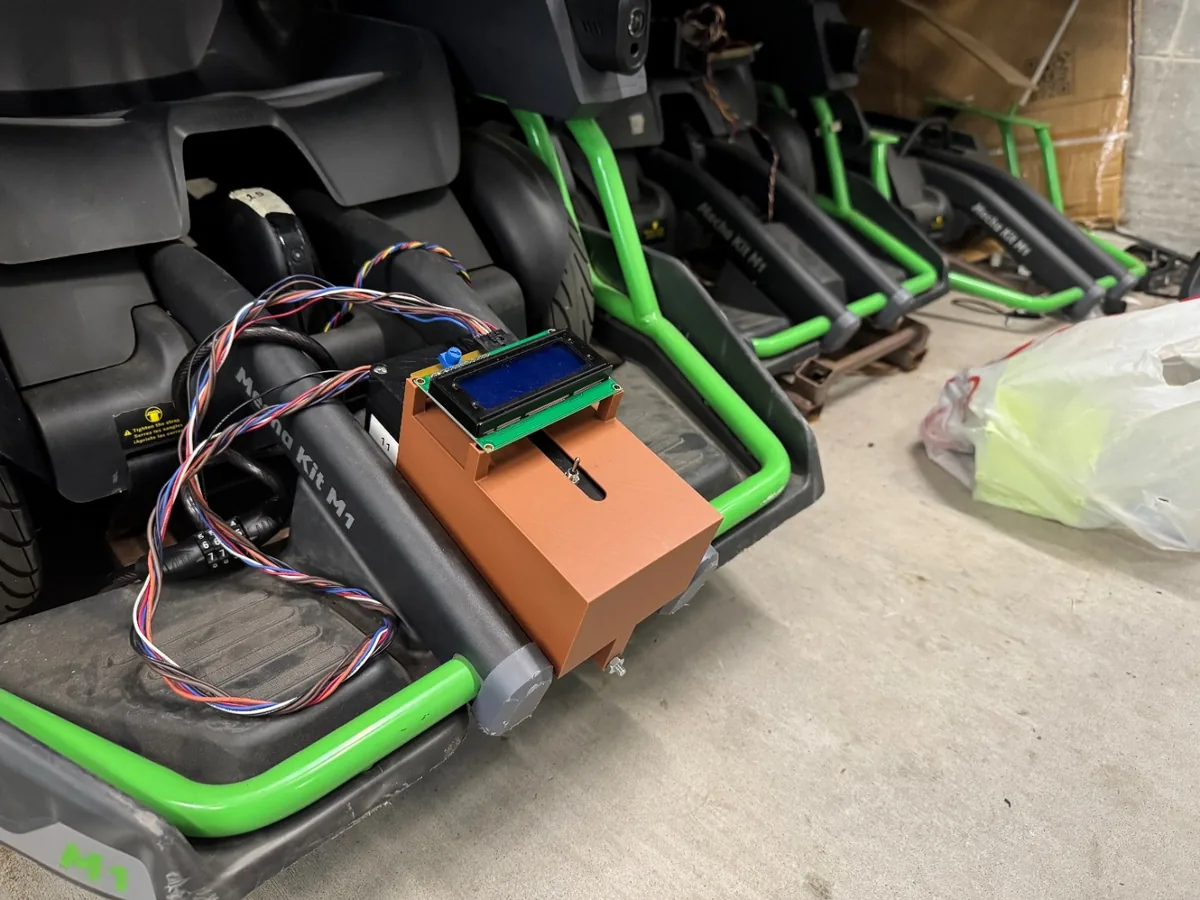
Proof of concept Separate AC and DC solar paths used an MPPT-controlled 12 V battery with either an inverter or a DC-DC converter. Cloudy conditions provided approximately 11 W, so a phone served as the proof load; the Ninebot was not charged from the solar setup. Three SolidWorks iterations also produced a compact FDM-printed mount with LCD locating pins and a frame clamp. Installing the final part verified physical fit and kept the electronics work tied to manufacturability and vehicle packaging.
Engineering Decisions & Trade-Offs
- Integrate against real timestamps. Trapezoidal integration preserved the logger's nonuniform sampling instead of introducing an artificial fixed-rate assumption.
- Keep standardized signaling in the loop. Pilot and proximity recognition made J1772 state changes part of the controller rather than treating the charger as a simple switched load.
- Use scenarios to test logic, but label them honestly. Hardcoded city conditions were sufficient to test rule interactions without implying live API or utility integration.
- Anchor extensions to measured data. The cold-weather comparison reused the 25°C trace, while the uncertainty of the literature-based 10°C model remains visible.
Results & Validation
The lap reconstructions agreed with each other within 0.02 Wh and remained in the same range as the onboard logger, while the regenerative split exposed a meaningful difference between drivers. More importantly, the J1772 bench test progressed from physical connection recognition through electrical activation and stable power delivery. The controller coordinated electrical states, schedule logic, sensing, switching, display feedback, and data logging in one observable transaction.
Impact, Limitations & Next Steps
The project produced an integrated micromobility test platform that connects vehicle telemetry, standardized charging communication, embedded decision logic, environmental analysis, and physical packaging. Its value is the ability to compare measured vehicle behavior with controlled charging experiments and explicitly bounded simulations—not a claim that the prototype optimizes a utility grid or is ready for production use.
Validation remains limited to short lap tests, one bench-scale charging setup, programmed rather than live city inputs, a modeled cold-weather case, and reduced-load solar experiments. The next defensible step would be repeated charging trials across measured ambient temperatures, synchronized charger- and battery-side instrumentation, and live but read-only weather and tariff inputs. Those additions would test repeatability and generalization without obscuring which conclusions come from hardware and which remain modeled.